Onlybees never just recorded the sale. From early on it also recorded the path the buyer took to get there: the session, the channel that brought them, the hesitation before checkout. The trouble was that, for a long time, all of that just sat there answering one question, how much did I make, and almost nothing else.
01The ledger and its ceiling
The original engine ran on one good idea: instrument the buyer's decision, not just the sale. It captured two streams. A clickstream of session events (view, ticket selected, checkout, payment attempted, confirmed, scanned) carrying attribution, and a flattened telemetry record written at confirmation that baked in features like days to the event, the fill percentage the buyer actually saw, seconds to purchase, and whether they were a repeat buyer. One endpoint ran ten MongoDB aggregations in parallel, cached the result for three hours, and optionally asked Gemini for five strategic insights.
For a v1 it answered real questions: how much, what sold, where traffic came from, when people buy. But it had a ceiling, and as order volume grew the ceiling started to show. Every cache miss recomputed all ten aggregations. Four of them did a full orders → events join purely to filter by organizer, because Order had no organizerId on it, so cost scaled with orders times events and a load past fifty thousand orders crept toward ten seconds. Worse, it was racy at the source, shallow in what it could show, and the telemetry collected to train a forecasting model fed a model that never existed.
We had always stored why someone bought, not just what they bought. We had just never done anything with it.
The premise, and the problem
02Make the data trustworthy
You cannot build intelligence on data that is racy, lossy, or unjoinable, so the first phase touched no dashboards at all. The worst offender was a race in payment confirmation: both the browser callback and the Razorpay webhook used a read-then-write guard, and under the right interleave both could pass the check and run the full post-payment workflow, double-issuing tickets and double-counting sales. The fix was to make the check and the write one indivisible step:
// Confirm a payment exactly once. Browser and webhook both call this;
// the guard and the write are one atomic step, so only one can win.
const won = await Order.findOneAndUpdate(
  { orderId, status: { $ne: 'SUCCESS' } },
  { $set: { status: 'SUCCESS' } }
);
if (!won) return;  // the loser never issues a ticket or moves a counter
With the substrate honest, we made it complete and joinable. Order now persists real attribution and a device class parsed from the user agent (a fifteen-line regex, no dependency), where before those reads silently resolved to undefined and fell back to organic. Telemetry gained a userId so cohort and lifetime-value joins no longer need an email lookup, repeat-buyer status comes from an indexed count instead of a fragile array length, and a two-year retention TTL keeps it from growing forever. We also closed an IDOR (the route had trusted an organizerId straight from the query string) and ran an idempotent backfill that honestly flags the fields that are lossy for history, so depth analytics can exclude them.
03Stop scanning, start reading
The dashboard scanned the whole Order collection on every load. We made it read instead. Denormalizing organizerId onto the order (with the matching index) deleted the join from the four heaviest pipelines outright. Then each confirmed sale started incrementally $inc-ing a materialized rollup: one row per event per day, plus an org-level daily row, carrying revenue, tickets, orders, and the device, source, and ticket-type breakdowns. The overview, per-event, top-tickets, and trend views now read that one-row-per-day collection rather than scanning orders, with the old scan kept as a fallback until rollups populate.
A confirmed sale also clears the cached aggregation immediately, while deliberately preserving the Gemini insights so a sale never burns an AI credit, and a nightly reconciler rebuilds the rollups from source to repair any drift. Freshness went from up to three hours stale to the next page load. Here is the whole write path of a ticket sale now:
Confirm atomically
One findOneAndUpdate guards and writes the status in a single step. Exactly one of the competing callers wins.
Bake the features
Device, channel, days-to-event and the fill percentage the buyer saw are computed and written onto the order and telemetry right there, never recomputed at read time.
Increment the rollup
The per-event-per-day row gets $inc-ed, so the dashboard reads a tiny pre-aggregated collection instead of the order log.
Bust the cache
The cached aggregation is cleared so the next load is fresh. All of this runs in isolated try/catch blocks, so it can never block or crash the payment.
The production migration that switched this on set organizerId on roughly 5,080 historical orders, backfilled 1,481 telemetry records, and built 820 rollup rows across 17 organizers, all idempotent and guarded by a cron secret.
04Who buys, not just what sold
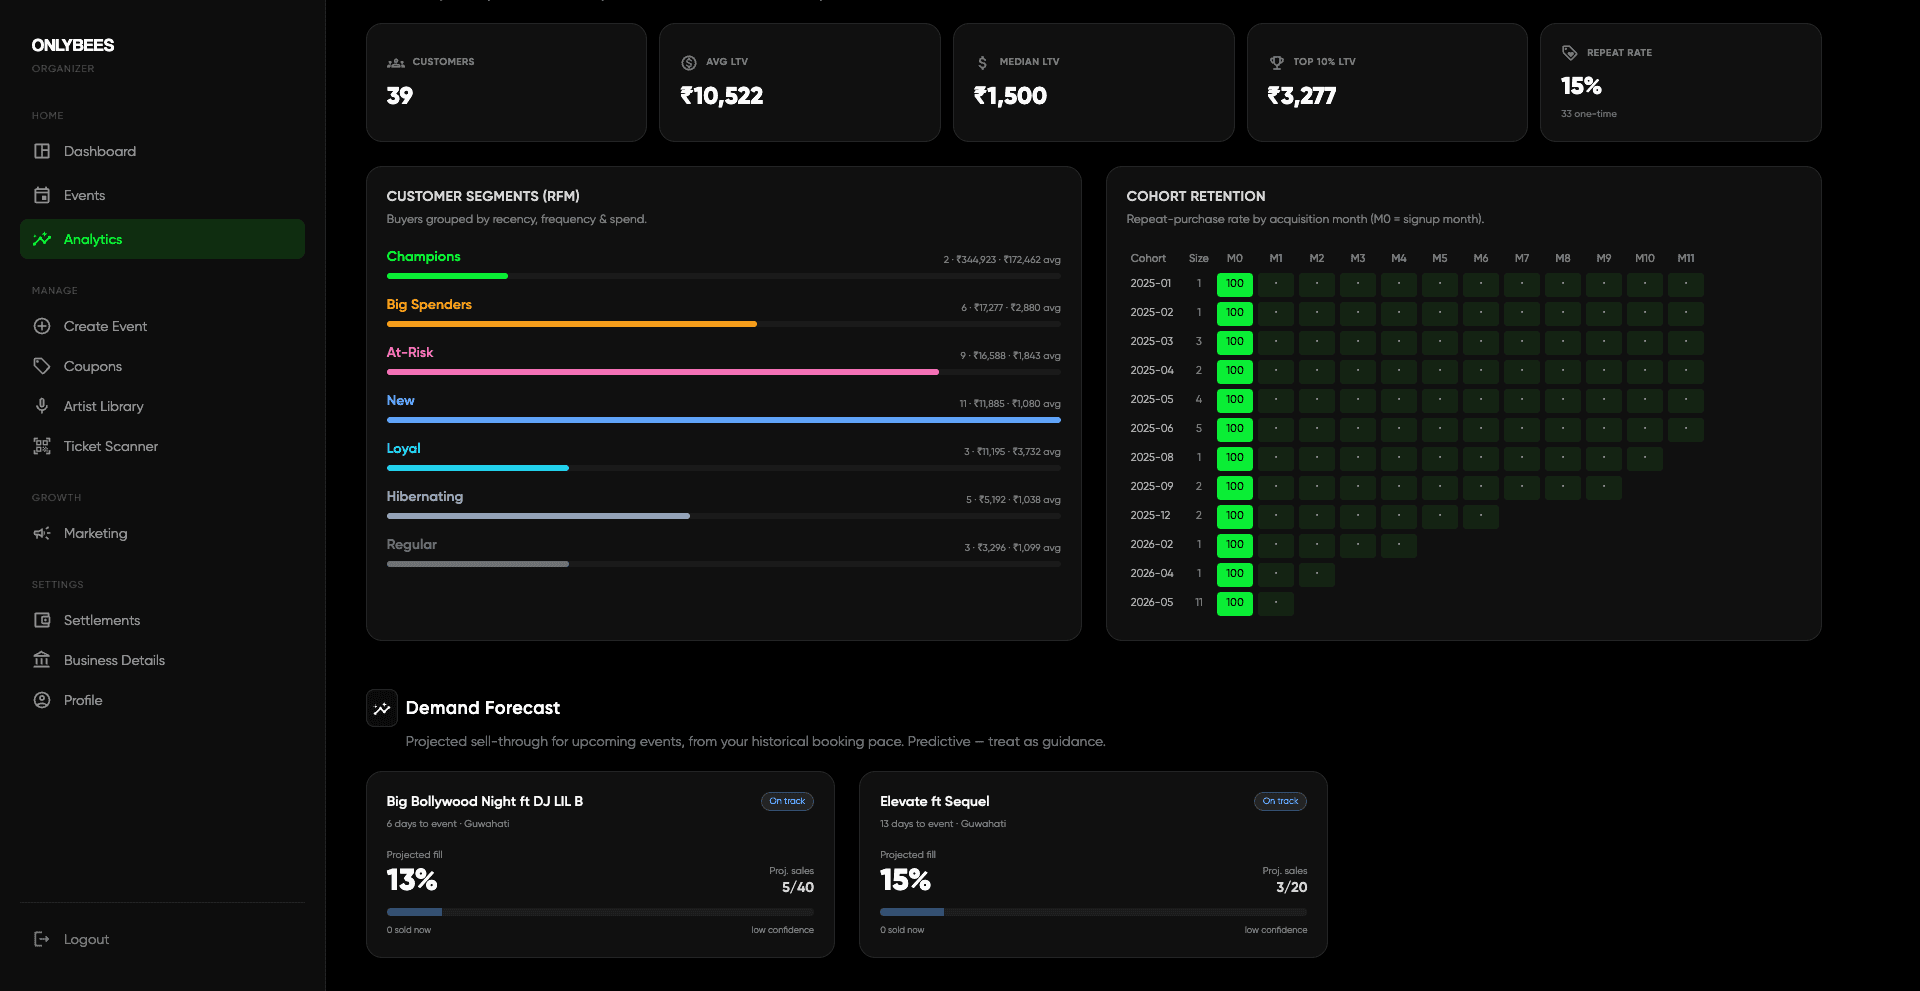
Up to here the dashboard could tell an organizer how their sales were doing, but nothing about their customers. So we added a small, dependency-free analytics layer: lifetime value (average, median, and top-decile spend, with the median next to the mean on purpose, because a couple of whale accounts badly skew the average), cohort retention, RFM segmentation that scores every customer on recency, frequency and monetary value and maps them to named segments (Champions, Loyal, At-Risk, Hibernating and the rest), a gated price-sensitivity estimate, and anomaly detection that watches the daily rollup series and flags revenue spikes, collapses, and sales droughts.
The cohort grid is the one I keep coming back to. Each row is a month's worth of new buyers; each column is how many of them came back N months later.
None of this shipped on trust. An adversarial review of the maths caught two real bugs first: the cohort grid was silently dropping zero-activity months, which made churn look invisible, and the RFM code had computed the monetary thresholds but never used them, so a big spender and a bargain hunter with the same recency landed in the same bucket. Both were corrected and re-verified against live data before an organizer ever saw them.
05A windshield, not a mirror
The telemetry had been gathered for a forecasting model that was never built, so we built it, lightweight and statistical rather than heavy ML. The demand forecastblends two signals: a booking-pace curve learned from the organizer's own history (the fraction of final sales they typically reach N days out) and the recent sales rate of the specific event. A brand-new event with no sales yet falls back to the organizer's historical average fill as a low-confidence prior. It reports projected final sales, projected fill, a sellout estimate, and a verdict of ahead, on track, or behind.
On top of that sits recommend-only dynamic pricing. Per ticket tier it combines pace, projected fill, and price sensitivity to suggest a rise when an event paces ahead with low sensitivity, or a discount when it lags near the date, capped at 15%. It never mutates a price: every row is a suggested advisory the organizer chooses to act on.
Review earned its keep again here. It caught a day-rounding mismatch between the forecast and the telemetry that misaligned the pace lookup, and a nastier one where a fresh event with zero sales projected zero final demand, read as behind pace, and tried to discount a ticket that had not even gone on sale. The historical prior fixed it, and on the live data the result was zero spurious discounts.
A ledger tells an organizer what happened. This tells them what to do about it.
From sales to buyer intelligence
06What changes for an organizer
All of it surfaces in the same dashboard they already use: a dismissible anomaly banner, a Customer Value and Loyalty section with LTV, RFM bars and that cohort heatmap, a Demand Forecast section with pace badges and sellout estimates, and a Pricing Recommendations panel showing current → recommended with an explicit suggestion only label. The Gemini prompt now folds those predictive and retention signals in, so its advice is grounded in the numbers rather than guessing on top of them.
A wall of new charts is its own kind of noise, though. So the last layer reads all of it, the pace, the segments, the anomalies, and hands the organizer a short brief in plain language: not another chart, but a few sentences on what is happening and what to do about it this week.
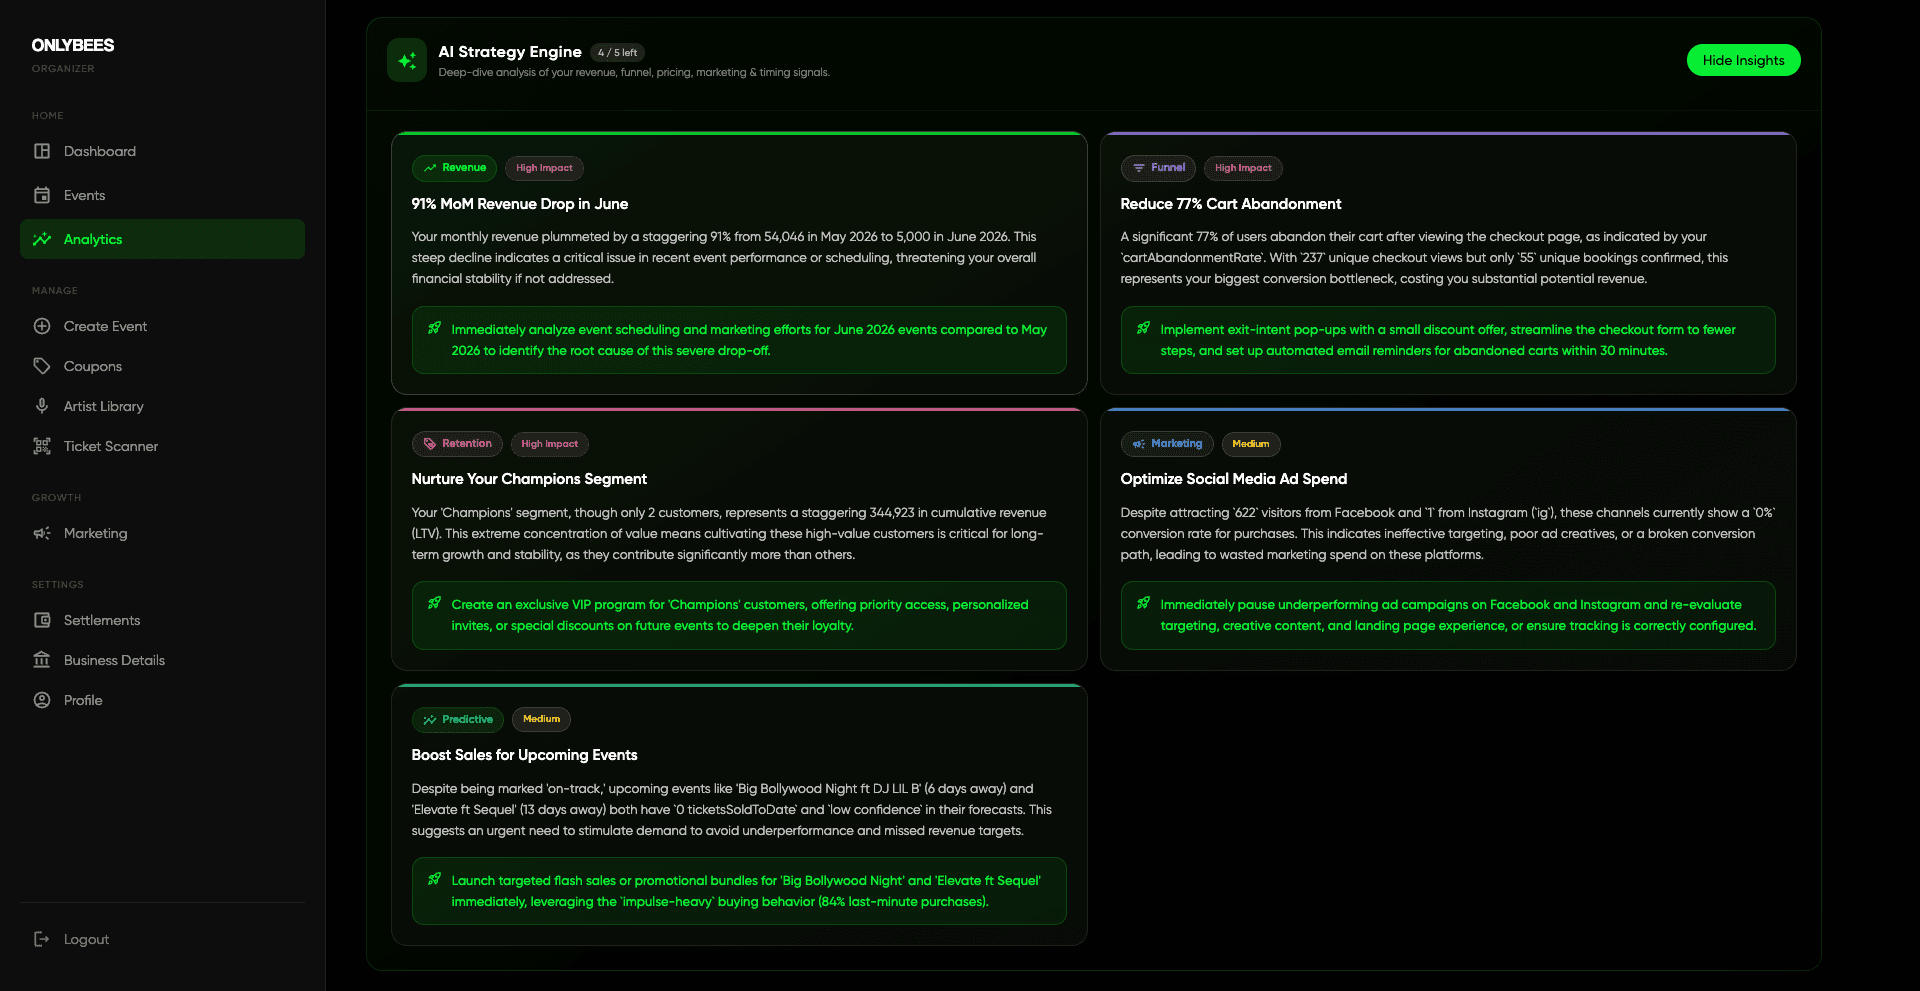
The throughline is one shift: from a sales ledger to a buyer-intelligence system. An organizer no longer just sees that 400 tickets sold. They see that a loyal cohort is slipping, that Instagram drives views but organic drives conversions, that an event six days out is pacing behind and could use a nudge, and that a handful of Champions quietly carry most of the revenue. That is the difference between a number and an understanding.
once confirmation was atomic
after the zero-sales fix
before any organizer saw them
A few principles held the whole rebuild together: instrument the decision, not just the transaction; bake features at write time so the dashboard and the forecast read without joins; keep telemetry off the critical path so it can never delay a payment; recommend, never auto-act; and adversarially verify the maths, because the four bugs that review caught would each have quietly misled an organizer. The engine still does the same simple thing it always did. It just finally says something worth hearing.
I build scalable products from the ground up: ticketing infrastructure, government platforms, and the backend systems that hold them together under load. I write up the ones with interesting failure modes.